
After a recent dip in oil prices, the U.S. Energy Information Administration (EIA) expects falling global inventories to support increased prices through the end of 2024, before succumbing to reduced consumption next year. (Source: Shutterstock)
After a recent dip in oil prices, the U.S. Energy Information Administration (EIA) expects falling global inventories to support increased prices through the end of 2024, before succumbing to reduced consumption next year.
The EIA’s forecast for 2024 has global consumption of liquid fuels increasing by 1.1 MMbbl/d in 2024 and 1.6 MMbbl/d in 2025—down from a previous forecast of 1.8 MMbbl/d as slowing economic growth in China reduces diesel consumption.
EIA’s Aug. 6 Short-Term Energy Outlook is also predicting slightly milder weather in August to cut down the use of natural gas for electricity generation. EIA forecast electricity generation will consume 46 Bcf/d in August, a 2% drop from a “very hot July.”
“Because of falling consumption and flat production, we expect the Henry Hub price to stay relatively low, remaining below $2.50/MMBtu through October,” EIA said. “However, we expect seasonal increases in consumption for space heating, along with a ramp up in liquefied natural gas (LNG) exports from new facilities in Texas and Louisiana, will push the Henry Hub price to average about $3.10/MMBtu from November through March.”
An Aug. 7 report by Macquarie Group’s Sales and Trading Personnel said the threat of recession and the possibility of a global economic slowdown has reduced demand for U.S. crude abroad, causing inventories to build.
EIA reported a 3.7 MMbbl drawdown in commercial crude and a reduction of 1.1 MMbbl in jet fuel during the week of Aug. 5.
“However, a 600,000 bbl build in crude inventory at Cushing, a 1.3 MMbbl gain in gasoline, as well as a 900,000 MMbbl increase in distillate stands in contrast to Macquarie’s expectations for small builds in crude and jet fuel, with a healthy draw in gasoline and distillate stocks slightly lower,” Macquarie analyst Walt Chancellor wrote.
Weak implied supply drove the relative strength in crude, offset by soft implied demand, which contributed to the relative weakness in products, Chancellor said.
Within the crude balance, runs were close to Macquarie’s expectations, with net imports slightly higher than expected—up 100,000 bbl/d. Implied domestic supply, with production adjustment and transportation, registered a “soft” 13.4 MMbbl/d, with the trailing four-week average dropping to 13.4 MMbbl/d nominally.
“These figures appear somewhat higher when adjusted for third-party estimated waterborne flows, but nevertheless appear disappointing at the moment,” he said.
Demand reduction
Gasoline, distillate and jet fuel demand was 14.4 MMbbl/d, below Macquarie expectations of 14.8 MMbbl/d. The trailing four-week average was 14.5 MMbbl/d versus 14.5 MMbbl/d for the same four-week period last year.
“Likewise, total disappearance, implied demand plus exports, for the three above mentioned products, was also light of our expectation at 17 MMbbl/d, as we were looking for approximately 17.4 MMbbl/d, with the trailing 4-week average at 17 MMbbl/d versus 17 MMbbl/d the same four weeks last year,” he said.
Crude runs are down 100,000 bbl/d year-over-year during the same period.
Going into next week, Macquarie sees potential for a commercial U.S. crude inventory build of 3.3 MMbbl, with a run up 100,000 bbl/d and a recovery in nominal implied supply of 500,000 bbl/d.
The firm also expects higher net imports of 600,000 bbl/d nominally and a slightly larger increase in the Strategic Petroleum Reserve inventory of 800,000 bbl.
U.S. exports decline
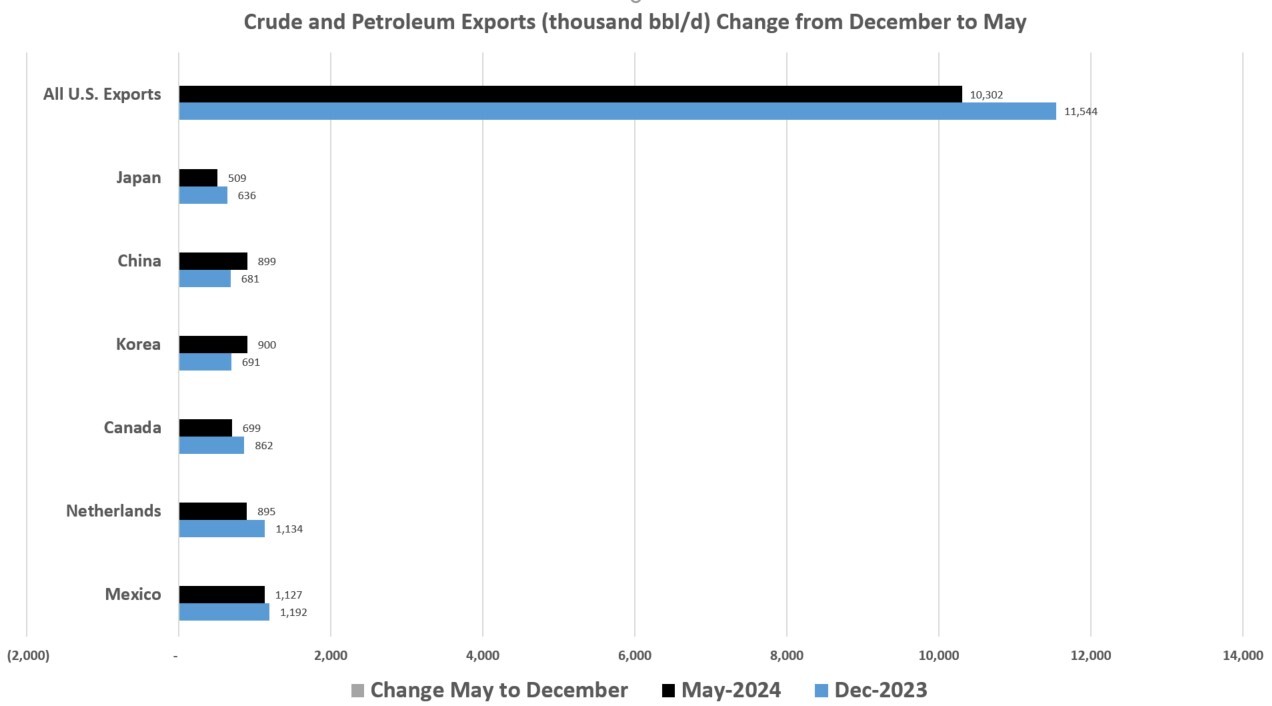
During the first five months of 2024, U.S. exports have been sliding. In May, total U.S. exports of crude and petroleum product averaged 10.3 MMbbl/d, a reduction of 1.24 MMbbl/d—11% from December 2023, according to EIA data. The U.S. exported a total of 11.54 MMbbl/d in December.
The most drastic reductions in exports during that same time-frame occurred in Italy (-59%), France (-52%), the U.K. (-34%), Taiwan (-25%) and Singapore/Netherlands (-21%).
However, the EIA reported that the steep reduction in U.S. crude exports are starting to mitigate. In April 2024, total U.S. crude exports were 10.51 MMbbl/d. In May 2024, oil exports were down slightly to 10.3 MMbbl/d, falling by 2%.
The largest month-over-month declines in U.S. crude were logged in the U.K. (-49%), Taiwan (-29%), Brazil (-28%), Canada (-18%) and India (-12%).
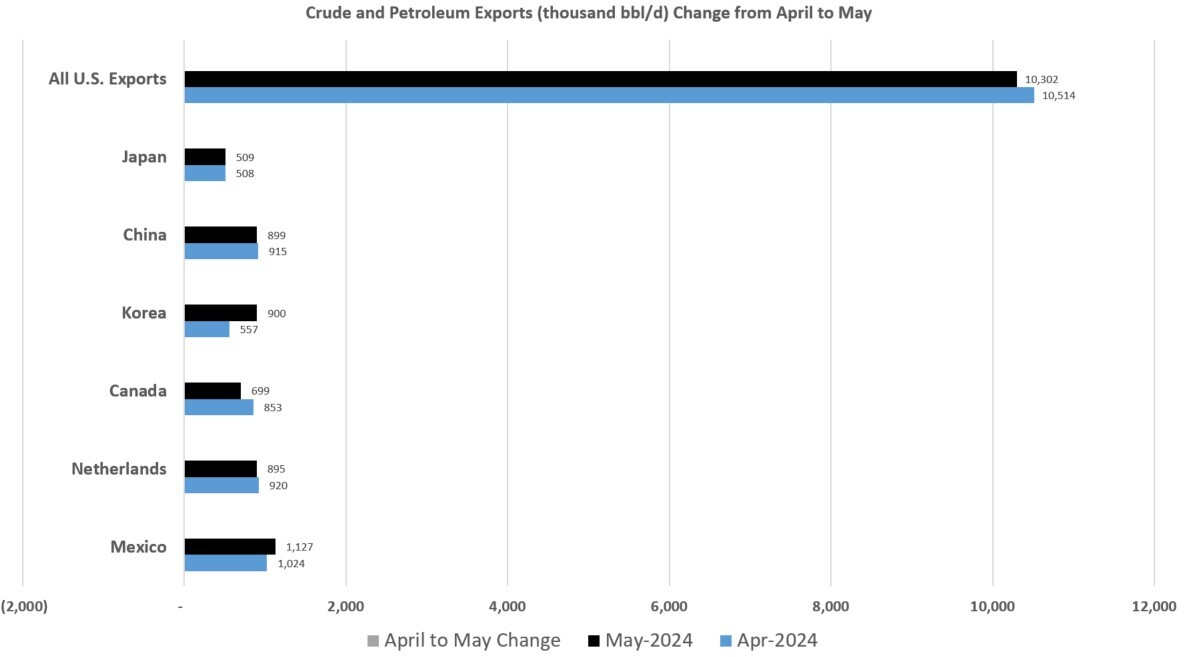
On the flip-side, large April-May gains were reported in Peru (80%), Korea (62%), Singapore (49%), France (19%) and Mexico (10%).
Recommended Reading

Occidental to Up Drilling in Permian Secondary Benches in ‘25
2025-02-20 - Occidental Petroleum is exploring upside in the Permian’s secondary benches, including deeper Delaware Wolfcamp zones and the Barnett Shale in the Midland Basin.

EQT: Gas Demand Likely to Outpace Midstream Sector’s Ability to Supply
2025-02-19 - Most infrastructure projects being built will not come online for another year—too late for the quickening pace of gas demand.

Obsidian to Sell Cardium Assets to InPlay Oil for US$225MM
2025-02-19 - Calgary, Alberta-based Obsidian Energy is divesting operated assets in the Cardium to InPlay Oil for CA$320 million in cash, equity and asset interests. The company will retain its non-operated holdings in the Pembina Cardium Unit #11.
Q&A: Petrie Partners Co-Founder Offers the Private Equity Perspective
2025-02-19 - Applying veteran wisdom to the oil and gas finance landscape, trends for 2025 begin to emerge.

Bowman Consulting Acquires Texas Firm UP Engineering
2025-02-19 - The acquisition of UP Engineering strengthens Bowman Consulting Group’s position in the oil and gas market, Chairman and CEO Gary Bowman says.
Comments
Add new comment
This conversation is moderated according to Hart Energy community rules. Please read the rules before joining the discussion. If you’re experiencing any technical problems, please contact our customer care team.