Drilling technology advancements over the past several decades have been leveraged in recent years to transform our industry and fuel the “Unconventional Revolution.” These incremental developments in drilling technology evolved gradually since the OPEC oil embargo in 1973 and the subsequent oil shock in 1979. These events and other geopolitical developments drove an explosion in global drilling activity, especially for highly complex offshore development projects that required huge, upfront capital investments and pushed the limits of existing technology.
Thus, this “new age” of drilling technology has led to more sophisticated directional, then extended reach, and now horizontal well drilling programs throughout the world, but especially in North America in unconventional resource plays. Over and over again, technology barriers have given way to allow today’s advanced, highly demanding horizontal well programs that commonly use “manufacturing mode” processes for achieving results never before anticipated or even believed possible.
Even with these incredible advancements, the industry continues to innovate and develop new drilling systems for achieving faster and faster drilling rates. But now, with these astonishing gains, the industry is hitting other boundaries and facing conflicting limitations due to interdependencies in closed-loop drilling systems. The question then becomes, can essential geological and drilling data needed to support the evaluation of the targeted strata keep up with rapid drilling rates? If not, as a result, a new dilemma has emerged for the integrated drilling, geosciences and production engineering team.
Conundrum
Both drilling and geologic data for true drilling-time decision support is essential, but when data is limited by MWD/LWD data transmission speeds for receiving the multitudes of varied measurements topside, other issues emerge as critical and limiting elements. Acquiring downhole data and sending it uphole via binary data transmission for informed decisions by the team is an incredibly complex operation, but skillfully and reliably carried off by our drilling service companies every day.
However, downhole data transmission speeds have not kept pace with improved drilling rates, creating an information “log jam” by limiting critical data flow from the subsurface. This bottleneck further hinders the team’s ability to make timely data assessments for evaluation and then execution by the integrated asset team.
One challenge is low bandwidth inherent to MWD/LWD transmission systems—both from the multitude of desirable petrophysical measurements such as natural gamma ray and azimuthal resistivity competing for the binary data channel capacity (mud column pulses) and drilling data such as azimuth, inclination, tool face orientation, bit vibration, downhole torque and drag and continuous inclination. The combination of petrophysical and drilling data is essential to basic geo-navigation principles and, ultimately, in application of that analysis for geosteering decisions for drilling optimum horizontal wells.
But to make matters even worse, geoscience and drilling disciplines’ competition for data channels is exacerbated by the real-world challenges of binary data transmission rates and signal attenuation through the fluid (mud) column—this problem becomes even more acute as we achieve deeper drilling depths and ever-increasing lateral lengths—thus reducing achievable and useful data rates even further.
Another factor is the applied measurement system’s sonde position well behind the bit, delaying the time that the various sensors actually measure their respective physical properties downhole in relative position to the drilling system, even before they are processed and sent uphole, further delaying the timeliness of the information topside.
So, each of these noted individual difficulties become worse when combined collectively. And they are even more severe as competition and inherent tradeoffs between disciplines create new challenges for the asset team members as operators continue to leverage technology to drill even faster, deeper and further in their horizontal well applications.
Exploring the tradeoffs
What’s not to like about these advancements for drilling faster? As enviable as this situation would have been in the 1980s or even the last decade, achieving the goal of optimising production by leveraging drilling technology with multimillion-dollar horizontal wellbores is being questioned.
Are we possibly applying too much technology, too soon, in our quest to meet short-term departmental goals of faster drilling rates (ROP) with less non-productive time (NPT), while missing the immediate objective of high initial production (IP), and ultimately, maximising estimated ultimate recovery and achieving greatest possible rate of return on investment (ROI)?
Wellbore position uncertainty
Problems with determining the wellbore’s true pathway and precise location at any given time is well understood and documented. Yet, many companies do not fully consider this issue when making critical decisions in both the planning and execution phases of drilling horizontal wells.
As has been documented in the Society of Petroleum Engineers paper by Stockhausen and Lesso (SPE79917), the magnitude of error of an MWD surveying system in their research has been demonstrated and is illustrated in Figure 1.
Fortunately, industry guidelines for quantifying both systematic and random errors are readily available in the public domain for understanding and managing the impact of these inaccuracies and sometimes flawed procedures. Stockhausen and Lesso’s research cited these problems common to MWD systems, and raise the possibility of further human-induced errors and other drilling industry “best practices” that have become commonplace in achieving faster-and-faster drilling rates, especially for horizontal wells.
Current drilling practices
Figure 2 illustrates two common drilling “best practices” that introduce systematic error into the wellbore position uncertainty formula. Drilling long, course length intervals between survey stations is one element leading to well position modeling errors: surveys are typically taken either every 10m or 30m depending upon the drilling interval in the curve.
A second drilling practice further introducing systematic error is sliding after each connection (survey station) and then rotating out the remaining drilling interval until reaching the next connection point where another survey is then taken. The net of those two common drilling practices is compounding both errors (long survey intervals and calculation errors in the calculation model.)
This problem is shown in Figure 3, with an exaggerated illustration using the radius of curvature calculation model. The resulting error is that the calculated position is deeper than the actual wellbore position in this case. Once again, these errors are compounding over the course of the well and poor decisions may be possibly based upon an inaccurate wellbore location versus the true well path.
Furthermore, Stockhausen and Lesso highlight that survey calculation model assumptions, along with these common survey interval and drilling practices, are all sources contributing to systematic error resulting in greater and greater uncertainty.
The minimum curvature survey calculation model shown in Figure 4 clearly illustrates that any vector-based calculation model has inherent limitations when fitting a smooth radius of curvature. In this case, a spherical calculation model (minimum curvature method) across an undulating wellbore course will yield subsurface positional errors in TVD (X), as well as northing (Y) and easting (X) positions. This error is cumulative and may render significant errors as the well is drilled ahead to TD.
One more procedure for reducing wellbore position uncertainty for consideration, and an opportunity to improve confidence, is the recommended best practice of taking more surveys on shorter intervals. Unfortunately, this requires drilling to stop, circulate off-bottom and taking a full directional survey more often as a means to more precisely measure, calculate and “track” a truer course of the wellbore. Naturally, the mere mention of “stop drilling” is frowned upon by the drilling team—increasing NPT and lowering ROP—key metrics that will raise ire of any driller when these benchmarks are negatively impacted.
But perhaps less impactful to the drilling team is to at least apply this practice (more surveys) at the end of any drilling transition point between “drilling states.” That is, a status-change from either a rotary drilling (rotating) to sliding (oriented TF) mode or from a sliding to rotational drilling interval. More frequent survey stations improve the accuracy of tracking the position of the wellbore, thereby increasing the level of wellbore position certainty.
So, while taking more frequent surveys has been documented and promoted to improve definition of a calculated wellbore path, it is still conflictive to achieving positive drilling marks and, as a consequence, it is greatly objectionable to the drilling team, and is rarely followed.
A possible compromise is yet another less impactful procedure that calls for “rotating out” of a survey station (after a drill pipe connection) and once again rotating out after the slide interval (curved section) before making another connection. Simply put, this process calls for “rotate-slide-rotate” intervals between survey stations (connections). The amount of sliding required depends upon the amount of course correction or “steering” that is necessary. This simple change in procedure as recommended by Stockhausen and Lesso renders a better survey calculation model result. Thus yielding a more accurate representation of the actual well path and projected bit position while drilling.
Continuous inclination
While using these recommended drilling best practices can be employed to mitigate some of the wellbore path uncertainty challenges, there is an even better option: continuous survey data.
The goal of continuous survey monitoring is similar. That is to overcome the lack of directional survey data (inclination and azimuth) between survey stations, thereby reducing uncertainty and more closely tracking your true course along the way.
As Figure 5 illustrates, when continuous inclination is tracked regularly (shown in red), the constant inclination values relative to the survey station measured inclination (blue line) are markedly different in most cases.
The net result is then calculated and dramatically confirms the impact on drilling ahead “blindly” without tracking inclination changes at least intermittently.
Memory data improves earth model
If continuous inclination is not a viable option while drilling—perhaps due to the service cost of this advanced sensor package or simply the tradeoffs of sharing desirable data channel bandwidth due to drilling depths or other factors—then, at a minimum, it is recommended that the memory data from the MWD system be used to produce a post-trip survey data file for computing a more accurate representation of the well’s course. Simply, the inclination data can be used to provide more frequent survey stations and to update the drilling path more accurately than otherwise possible.
Likewise, petrophysical data gaps due to slow transmission speeds, bandwidth competition and fast drilling rates can be overcome by infilling with memory data from the LWD system after it is brought to the surface.
TSP to the rescue
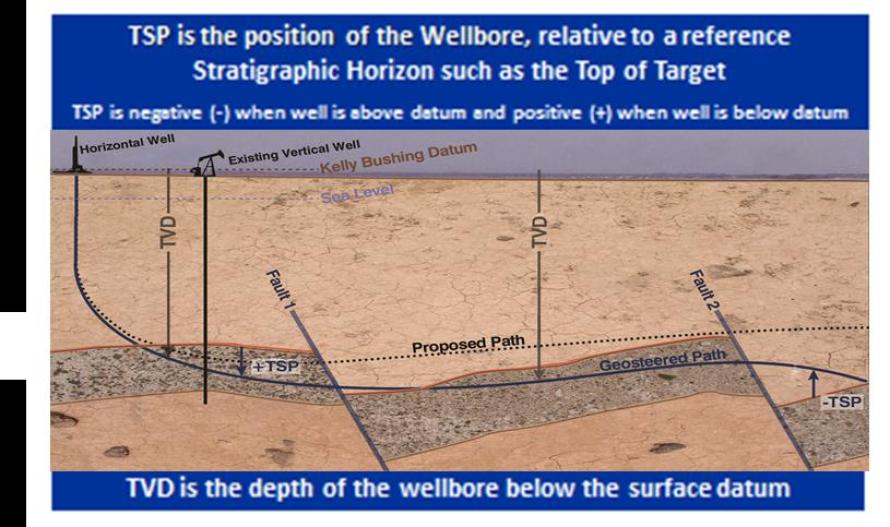
Fortunately, while these downhole measurements are essential for understanding the drilling formation properties and a well’s physical position in the subsurface while drilling, these shortcomings can be at least partially overcome in true drilling time. By applying good geo-navigation techniques for determining TSP of the drilling system, the goal of “staying in zone” can be mostly achieved.
Many directional drillers will argue that they must have directional surveys and an accurate wellbore position to plot where they are in the subsurface relative to a well plan and then for making good drilling decisions relative to a target line. While the former may be true, if the ultimate goal is to stay within a geologic window or targeted formation zone, then the actual position of the wellbore relative to a geologic marker is the key geo-navigation parameter.
In other words, pinpointing the well’s true stratigraphic position (TSP) and drilling dip angle are really the critical information required by the geosteering team. That is, the operations geologist in concert with the drilling data and other drilling personnel’s primary objective is to know the wellbore’s precise stratigraphic position and drilling attitude relative to the apparent formation dip at any given moment—a process referred to as geo-navigation.
The TSP modeling technique employed by geo-navigation specialists is used to determine the relative position of the logging sensor —typically a gamma ray detector housed within the LWD system—in the subsurface by using log correlation techniques within specialised software that also provides the expert geo-navigator with a means to swiftly determine apparent formation dip angle. Using these data (TSP and apparent dip), targeting decisions and recommended borehole course corrections may then be made; these steps are collectively known as geosteering.
Still, these geo-navigation data measurements (both petrophysical and positional) as noted earlier are critical for relating TSP back to the earth’s geo-model for making sound, timely geosteering decisions and keeping the horizontal path in the optimal, targeted production zone. Of course sound industry geosteering best practices, including recommended targeting methodology, consider the many tradeoffs so as to not unnecessarily “chase” formation changes and avoiding the creation of new, potentially serious, drilling and completion problems as a consequence of an undulating and porpoising wellbore.
Recommended targeting best practice
The recommended methodology is “vector-based” targeting. This technique uses TSP modeling results along with the resulting apparent dip calculations relative to current drilling inclination.
Very simply, the current TSP and apparent dip angles are compared with the drilling orientation to determine an optimal target vector. The result is a “zero vertical section” (VS0) position at a specific TVD location with a desired new inclination angle for use by the DD. This gradual change will occur over whatever course length is required to softly “land” on the prescribed VS0 at a given true vertical depth (TVDy1) with the prescribed vector line angle (inclination1).
Subsequently, as needed, the target vector can then be easily updated as needed. Again, over time, the DD will again bring the well path onto a new “landing vector” and well trajectory.
Right tools for the job
As is certainly the case for conventional resource developments, not every unconventional resource play is the same. Every play has its own challenges and inherent risk due to so many variables. Geologic risk may be due to sparse data and little well control. Geologic complexities that need to be considered are regional, local and even well-specific structure, faulting and the potential for changes in facies and other formation unconformities. And there are so many more challenges created by insufficient and unavailable data to further understand the uniqueness of each unconventional resource play.
And over time these elements can change in importance as play delineation provides new geologic and reservoir insight and other new data that is brought to bear to provide a better understanding of the resource in place and evolving best practices that may become available.
Ultimately, this new knowledge can be leveraged for attaining optimal economic and key corporate objectives for each of the stakeholders. As such, the technology deployed at the start of a project could (should?) be different as the play evolves. Be sure to deploy solutions that can be scaled up or down as new challenges arise or are met with new information and technology is put into play.
And very importantly is your asset team’s organisation itself. The group should operate like a well-oiled machine that is in-sync with each other’s goals at all times. This is especially true “after hours,” on nights and weekends, when problems seem most likely to come up. A clear definition of what are appropriate responses to a given situation during planning and execution of a program that meets each of the most important criteria of each discipline in the lineup should include your service companies, as well as the reservoir and production team members.
Be sure to scale your services solutions and your asset team’s skills to meet the demands and complexity of each project.
Recommended Reading
US Drillers Cut Oil, Gas Rigs for First Time in Six Weeks
2025-01-10 - The oil and gas rig count fell by five to 584 in the week to Jan. 10, the lowest since November.
Baker Hughes: US Drillers Keep Oil, NatGas Rigs Unchanged for Second Week
2024-12-20 - U.S. energy firms this week kept the number of oil and natural gas rigs unchanged for the second week in a row.
Baker Hughes: US Drillers Keep Oil and NatGas Rigs Unchanged for Third Week
2024-12-27 - U.S. energy firms this week operated the same number of oil and natural gas rigs for third week in a row.
US Oil and Gas Rig Count Rises to Highest Since June, Says Baker Hughes
2025-02-21 - Despite this week's rig increase, Baker Hughes said the total count was still down 34, or 5% below this time last year.
US Drillers Cut Oil, Gas Rigs to Lowest Since December 2021, Baker Hughes Says
2025-01-17 - The oil and gas rig count fell by four to 580 in the week to Jan. 17.
Comments
Add new comment
This conversation is moderated according to Hart Energy community rules. Please read the rules before joining the discussion. If you’re experiencing any technical problems, please contact our customer care team.