Understanding formation wettability is vital to accurate characterization of oil reserves and optimization of recovery. Wettability significantly affects resistivity, capillary pressure, relative permeability and residual saturation. In a water-wet reservoir, the formation brine remains in contact with the rock. In an oil-wet state, oil contacts and adheres to much of the surface, which can disconnect the formation brine and lead to poor estimation of hydrocarbon saturation from resistivity measurements.
Waterflooding of a water-wet rock tends to lead to snap-off and bypassing of oil in the larger pores. The opposite is true of oil-wet rocks, in which oil remains connected by its stronger adhesion to rock surfaces. This may limit its displacement to the larger pore pathways. The majority of reservoirs are thought to be in a mixed-wet state, in which oil contacts some of the rock, dictated by the prevailing capillary pressure and oil affinity for mineral surfaces. This favors retention of oil and brine connectivity during waterflooding, which can result in greater oil production.
Standard core testing
The two standard laboratory methods are the Amott-Harvey and USBM tests, based on measurements of changes in saturation and capillary pressure from drainage and imbibition. The plug undergoes primary drainage and aging at irreducible water saturation followed by spontaneous and forced imbibition (usually by centrifugation). The process is then repeated for spontaneous and forced secondary drainage. The USBM and Amott methods characterize the wettability state responsible for these displacement responses in terms of one and two indexes, respectively.
This simplification results in a lack of sensitivity, especially to the most common and most subtle state of mixed wettability, and gives no information of the pore-scale wettability variation and its plug-scale heterogeneity, which contribute to the overall averaged index. Wettability remains one of the major uncertainties in reserves estimation, reservoir scenario planning, and pore-scale modeling and simulation. This lack of knowledge especially hinders the design of EOR strategies such as low-salinity waterflooding to alter wettability during recovery.
Microscopy techniques
Advanced 3-D microscopy techniques such as the services offered by FEI enable engineers to supplement these classical indices and cartoons of pore-scale displacements with direct observations of the oil-brine occupancy of pores in their rocks. Through unique imaging and registration technology coupled with proprietary workflows, pore-scale imaging of oil in place has been demonstrated in preserved or restored reservoir plugs and its changes on further drainage or imbibition.
After cleaning, 2-D scanning electron microscope (SEM) and quantum electron microscope techniques enable higher resolution mosaics and mineral maps of polished sections to be registered into the corresponding tomogram slice. The detailed structure of micro-pores and the mineralogy of pore surfaces aid in understanding the mechanisms responsible for the observed residual oil distribution. Further, high-resolution field-emission SEM (FESEM) images of raw cut sections provide visualization of the local distribution of asphaltene on pore surfaces due to the pore surfaces’ wettability alteration by the oil.
Case studies
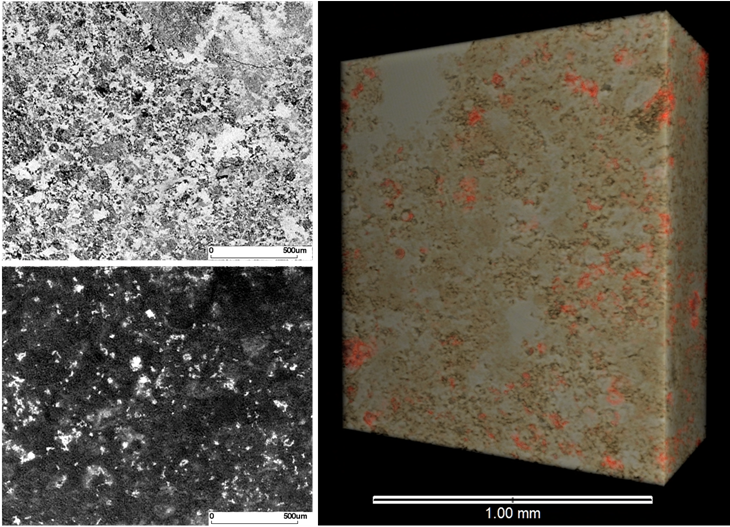
A recent study (IPTC 17696, 2014) commissioned by Maersk Oil Qatar and conducted jointly by Lithicon (purchased by FEI in 2014) and the Australian National University performed 3-D imaging and wettability analysis on preserved-state carbonate core from a waterflooded zone of the Al-Shaheen Field. Micro-computer tomography (microCT) was used in combination with novel X-ray contrast techniques and image registration to visualize the 3-D pore-scale distribution of oil in place (Figure 1).

FIGURE 1. The sub-area of a tomogram slice through a reservoir carbonate is shown in its preserved state (a) and contrast-enhanced state (b), in which local oil saturation increases with grayscale brightness; (c) shows a 3-D visualization of the oil in place (red) in the rock (brown shades). (Source: FEI)
Segmentation of the residual oil gave a total saturation that was in good agreement with laboratory measurements on sister plugs and showed that a disproportionally high fraction resided in macro-pores. This was consistent with the observation from high-resolution FESEM imaging of raw cut sections that macro-pores were more water-wet than micro-pores.
A more recent study dealt with restoration of a reservoir sandstone, which was microCT scanned after aging and after spontaneous and forced imbibition by centrifugation. Spontaneous imbibition was virtually nil, while the residual oil after forced imbibition was closely associated with rock surfaces and in tighter pores.
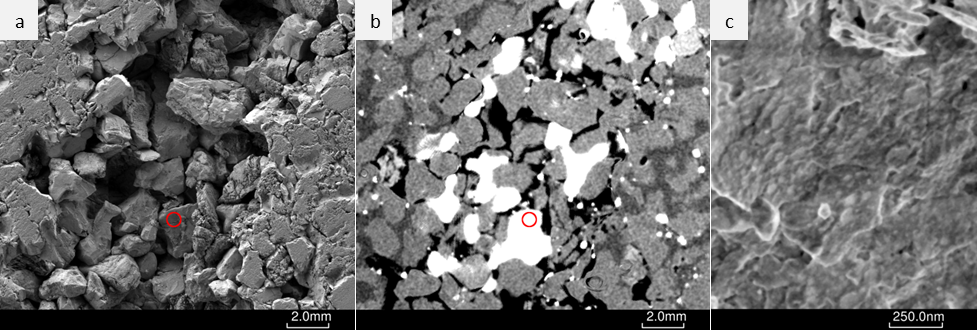
The 2-D SEM mosaic of the raw cut section of the cleaned plug (Figure 2a) was registered into the tomogram of the uncut plug after forced imbibition (Figure 2b). This allowed the higher resolution FESEM imaging to focus on walls of pores in which the oil saturation exhibited interesting changes.

FIGURE 2. In (a), a low-resolution SEM mosaic of a raw cut face of a restored reservoir sandstone is shown; (b) shows a registered projection of the same topography within the plug after forced imbibition (and prior to cutting), with brine in white, oil in black and rock in grayscales; and (c) is a high-resolution FESEM close-up within the red circle, showing the nodular texture of the asphaltene film on grain-lining clays. (Source: FEI)
For example, within the red circle in Figure 2b, forced imbibition removed oil from a clay-lined grain that was seen by FESEM in Figure 2c to be completely covered by asphaltene film, which is in line with the oil-wetness inferred from microCT. The simulated oil/water displacement results from pore network modeling of the reservoir sandstone using this educated assignment of wettability parameters showed good agreement with available SCAL data.
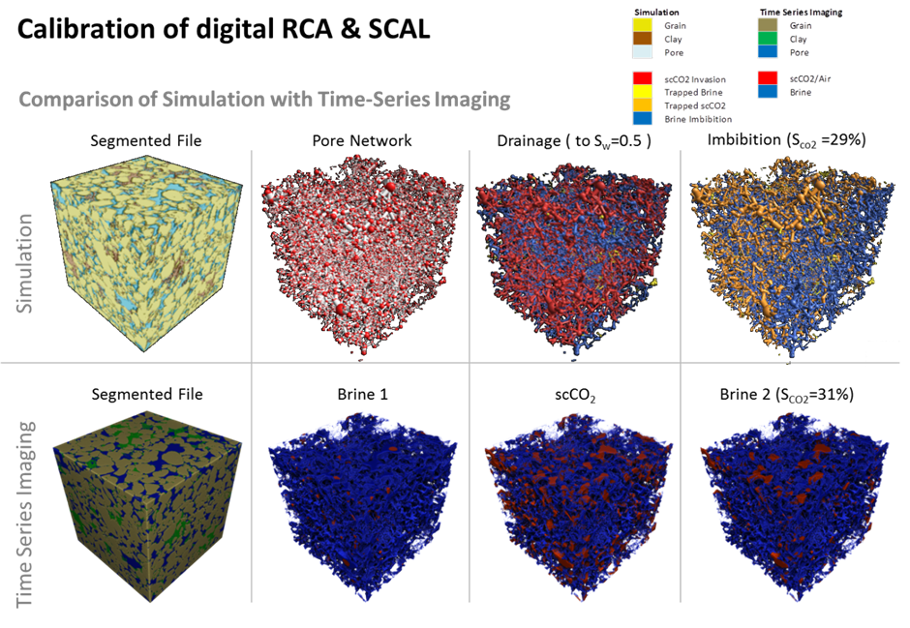
Figure 3 shows as a final example a flow experiment in which a cleaned reservoir sandstone plug was first drained by injection of supercritical CO2 and then subjected to brine imbibition to determine the extent of capillary trapping and suitability for sequestration. This time series imaging in the lower row of Figure 3 was well matched by the two-phase flow simulation in the pore network in the upper row of Figure 3. These examples illustrate how physical measurements and direct imaging of pore-scale processes and wettability in drainage/imbibition cycles can be used to anchor digital models of special core analysis.

FIGURE 3. Simulation is compared to time-series microCT imaging of drainage of a brine-saturated rock by injection of super-critical CO2 followed by imbibition. (Source: FEI)
From this point, an operator can more reliably and predictively use digital models to consider multiple recovery scenarios and to plan improved production strategies on the same core material.
Recommended Reading
McDermott Completes Project Offshore East Malaysia Ahead of Schedule
2025-02-05 - McDermott International replaced a gas lift riser and installed new equipment in water depth of 1,400 m for Thailand national oil company PTTEP.
E&P Highlights: Dec. 9, 2024
2024-12-09 - Here’s a roundup of the latest E&P headlines, including a major gas discovery in Colombia and the creation of a new independent E&P.
TotalEnergies Awards SBM Offshore FPSO GranMorgu Development Contract
2024-11-15 - SBM will construct and install a floating production, storage and offloading vessel for TotalEnergies alongside its partner Technip Energies, the company said.
SLB to Manage Construction of Deepwater Wells for Petrobras
2024-12-11 - SLB will work off nine ultra-deepwater rigs to oversee the construction of deepwater wells as part of the $800 million, three-year deal with Petrobras.
E&P Highlights: Jan. 6, 2025
2025-01-06 - Here’s a roundup of the latest E&P headlines, including company resignations and promotions and the acquisition of an oilfield service and supply company.
Comments
Add new comment
This conversation is moderated according to Hart Energy community rules. Please read the rules before joining the discussion. If you’re experiencing any technical problems, please contact our customer care team.


