For all the angst caused by this year’s 65% oil price leap, concerns about a return to 1970s-style stagflation are overblown and the developed world, at least, can probably handle even costlier crude without too much stress.
Alternative energy sources, a rise in less energy-intense service sectors, plus more efficient vehicles, gadgets and power plants mean that oil demand has evolved, not just from the 1970s but even since 2008 when oil futures neared $150.
Below are a series of graphics detailing the role of oil and the impact of its current price surge:
1. How Intense?
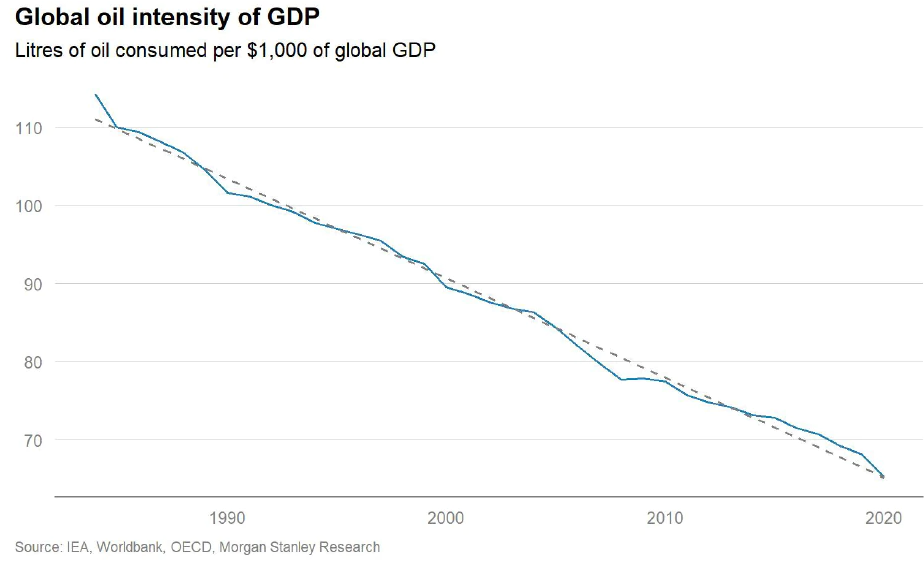
Oil intensity—the volume of oil consumed per unit of gross domestic product—dropped 56% between 1973 and 2019, according to Columbia University’s Center for Global Energy Policy.
So if in 1973 it took a little under one barrel of oil to produce $1,000 of economic output, that figure has fallen to less than half a barrel.
As recently as 2010 more than 75 liters of oil were consumed per $1,000 of global GDP—today it's 65 liters, Morgan Stanley analysts note.
One likely cause is intermediate users such as power plants switching away from oil.
End-users such as motorists remain reliant on petrol but thanks to tech advances, the average U.S. car gets 25 miles per gallon versus 13 miles in 1975.

2. Oil Is Cheap
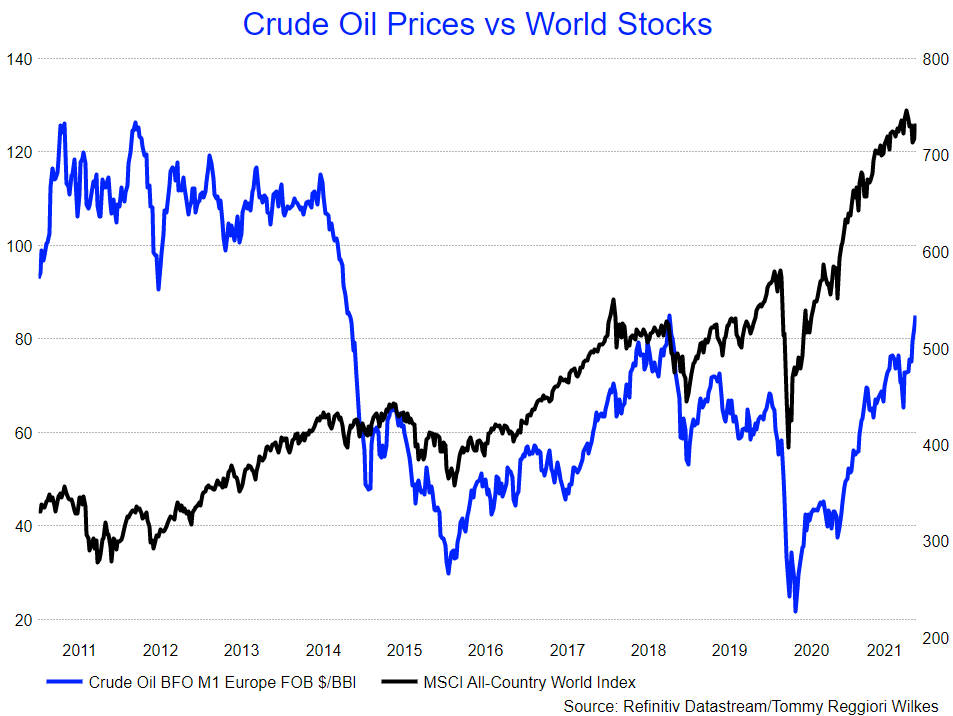
Yes, really. Despite the 430% jump in Brent crude since March 2020, oil looks inexpensive on a longer-term view.
Since early 2011, global equities have surged 125%, major cities have witnessed double or triple-digit house price growth but Brent futures are down 10%.
Oil averaged more than $100 a barrel between 2010 and 2015 and the global economy and markets held up fine, note JPMorgan strategists Marko Kolanovic and Bram Kaplan.
“We do not believe that the current price of energy will have a significant negative impact on the economy,” they wrote.
“Adjusting for inflation, consumer balance sheets, total oil expenditures, wages and prices of other assets, we think even with oil at $130 or $150, equity markets and the economy could function well.”
Oil prices historically become problematic when energy costs exceed 8.8% of global GDP, levels last seen in 2008, say BofA analysts.
As of Oct 8. when their note was sent, energy's share was 5.6%, they wrote. So overall energy costs would need to rise another 60% to hit the threshold.

3. There Are Alternatives
Oil's share of the global energy mix has shrunk to 29% from around 50% in the 1970s, as use of natural gas and renewable sources has grown.
The International Energy Agency sees that falling to 28% by 2030 and 22% by 2050 if governments meet their climate-related commitments. Renewables’ share, now at 12%, would rise to 19% and then 37%.
Energy demand may also be decoupling from economic growth, says consultancy McKinsey, which cites the renewables expansion, increased electrification and the growth of services in countries such as China, once reliant on industry.

4. What If?
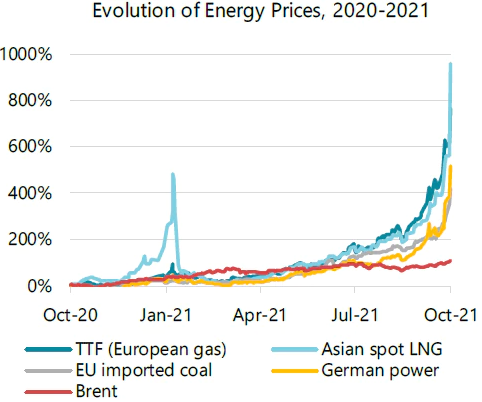
One threat is that alongside oil, prices of other energy sources also rocket—gas and coal prices have hit record levels.
“There is nowhere to hide,” said Thomas Costerg, senior economist at Pictet Wealth Management. “Oil at $80 is more painful than it would normally be because gas and coal are also at record highs.”
The impact of costlier power could hit harder if it forces consumers to cut back on Christmas spending, he added.
BofA’s analysts reckon the global “consumption tax” from the energy price shock could be as large as 1.6% this year.
And what if predictions of ‘peak oil demand’ come up short?
Morgan Stanley’s analysts, who this week predicted Brent would hit $95 in the first 2022 quarter, argue that as investment in new production falls, ‘peak oil supply’ may actually arrive before peak demand.

5. Emerging Worries
The outlook for emerging markets is more troubling.
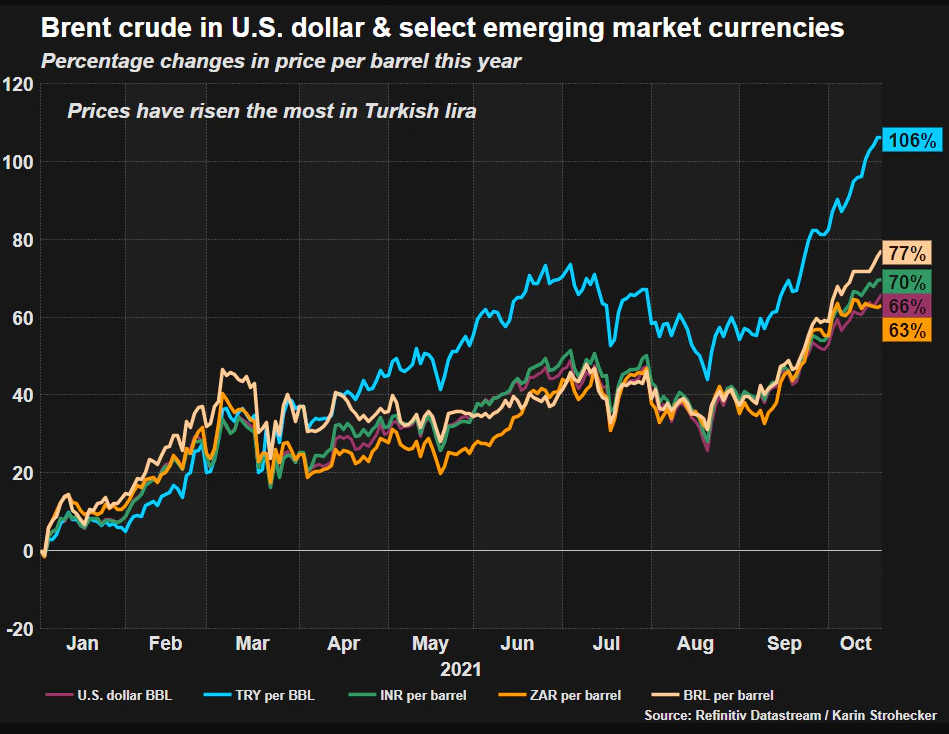
Big oil importers including the Philippines, Thailand, India and Turkey face a double whammy—weakness in their currencies against the dollar exacerbates the shock.
A barrel of Brent costs 785 lira for Turkish buyers. for example, versus 370 lira in early-2021. Prices have nearly doubled in Indian rupees and Thai baht.

Recommended Reading
Mexico Pacific Working with Financial Advisers to Secure Saguaro LNG I FID
2024-10-23 - Mexico Pacific is working with MUFG, Santander and JP Morgan to arrange the financing needed to support FID and the anchor phase of Saguaro Energía LNG.
Exxon, Chevron Beat 3Q Estimates, Output Boosts Results
2024-11-01 - Oil giants Chevron and Exxon Mobil reported mixed results for the third quarter, with both companies surpassing Wall Street expectations despite facing different challenges.
ConocoPhillips Hits Permian, Eagle Ford Records as Marathon Closing Nears
2024-11-01 - ConocoPhillips anticipates closing its $17.1 billion acquisition of Marathon Oil before year-end, adding assets in the Eagle Ford, the Bakken and the Permian Basin.
E&P Consolidation Ripples Through Energy Finance Providers
2024-11-29 - Panel: The pool of financial companies catering to oil and gas companies has shrunk along with the number of E&Ps.
Comments
Add new comment
This conversation is moderated according to Hart Energy community rules. Please read the rules before joining the discussion. If you’re experiencing any technical problems, please contact our customer care team.


