
(Source: westtexasfish/Shutterstock.com)
The shifting winds of exploration and development have kept Oklahoma’s Midcontinent producers swaying. Man-made forces like market volatility to the nature-made complexities of the state’s subsurface have led many early entrants into the state’s Scoop/Stack play to exit or reset expectations and restrategize their development approach.
In an exclusive report provided to E&P, Enverus noted that prior to 2016, the Scoop/Stack play was a relatively quiet and isolated unconventional play. Private-equity-backed operators successfully drilled and flipped acreage across the region, with impressive well results bringing more public operators into the play.
After remaining relatively level throughout 2018, the permit count in the Midcontinent has steadily dropped from 474 in the first quarter of 2019 to 179 in the third quarter. The Stack’s Kingfisher, Canadian and Blaine counties have all seen a significant decrease in the count, with Kingfisher being the most notable. The permit count in the Scoop’s Grady and McClain counties, while still decreasing, has not been as dramatic as that of the Stack counties (Figure 1), according to Enverus.
LEASING HOT SPOTS

Drilling metrics have improved year over year (YoY) for the past five years, with average total rig days on location dropping to 30 in 2018, while footage drilled per day surpassed 700 ft, as compared to more than 45 days in 2014 drilling a little more than 400 ft/d (Figure 2).

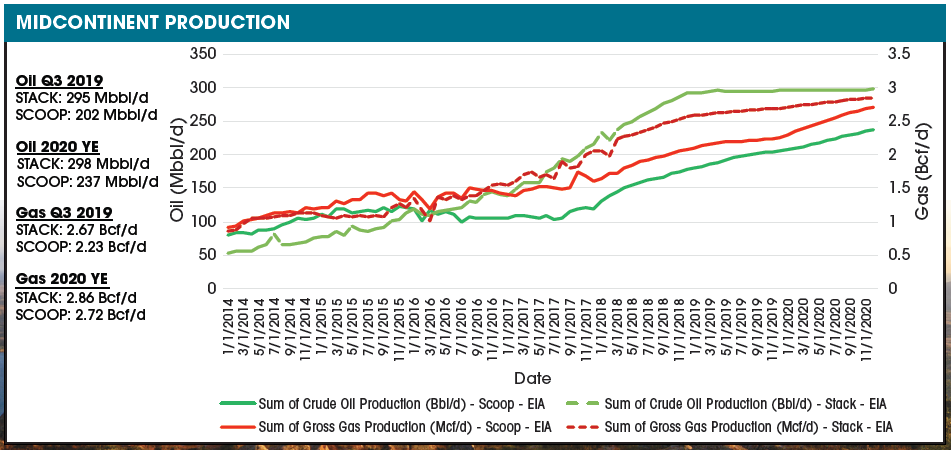
According to the report, completion trends in terms of frac intensity and perforated lengths have been consistent since 2016, while normalized well performance has declined. This decline is due to a variety of factors, including the poor performance from infill wells and mixed results of expanding outside the core of the play (Figure 3). For the Stack, Enverus projects nearly flat production for the next 18 months, while production is expected to grow in the Scoop (Figure 4).
“This disparity in the production forecast is driven by the difference in lower rig counts in the Stack (-25 from the start of 2019 to the end of the second quarter) versus the Scoop (-5 from the start of 2019 to the end of the second quarter),” according to the report.
COMPLETION PRACTICES OVER TIME

Recommended Reading

Energy Transition in Motion (Week of March 14, 2025)
2025-03-14 - Here is a look at some of this week’s renewable energy news, including a record-breaking year for solar capacity additions.
Energy Transition in Motion (Week of March 28, 2025)
2025-03-28 - Here is a look at some of this week’s renewable energy news, including another record for renewables power capacity growth.
Energy Transition in Motion (Week of Feb. 14, 2025)
2025-02-14 - Here is a look at some of this week’s renewable energy news, including a geothermal drilling partnership.

First Solar Continues to Ride Growth Streak Fueled by Incentives, Demand
2025-02-26 - First Solar ended 2024 with a contracted backlog of 68.5 gigawatts valued at $20.5 billion, having sold a record 14.1 GW of modules.

Solar, Clean Energy Face Headwinds Amid Post-Election Uncertainty
2025-01-22 - With a new Trump administration taking charge, renewable energy, including solar, may face headwinds that stagnate project development or continue it at a slower pace, analysts say.
Comments
Add new comment
This conversation is moderated according to Hart Energy community rules. Please read the rules before joining the discussion. If you’re experiencing any technical problems, please contact our customer care team.